On Saturday mornings you can usually find me doing some sort of random craft project with my favorite tiny human. My daughter is a high energy curious 5 year old and I’m always trying to feed into her enthusiasm with open-ended toys, simple science experiments, origami, or drawing & coloring.
Much of the coloring she delegates to me (of course) and lately while filling in numerous random shapes I’m reminded of an interesting challenge I encountered while playing with an open-ended toy of my own.
Almost immediately after building and experimenting with my robotic cup plotter project I realized that smart path planning of drawing strokes is critical to getting jobs completed in a reasonable amount of time.
Plotters, 3d printers, & cnc machines in general can be mesmerizing to watch, but fascination can turn to frustration when poorly planned tool paths remind you just how dumb these machines really are.
“Gahhhh why is my machine drawing little bits all over the place rather than finishing off an entire area before moving on?”
Last month I shared how plotters use vector graphics in order to build a list of toolpaths needed to map out jobs, and I doted on Potrace for being the most common program used to generate vector graphics.
But as great as Potrace is, one thing is does not do for you is optimize the path order.
Optimizing paths is simple in theory, and yet impossible to get perfect in even a moderately complex job. A very interesting problem!
..
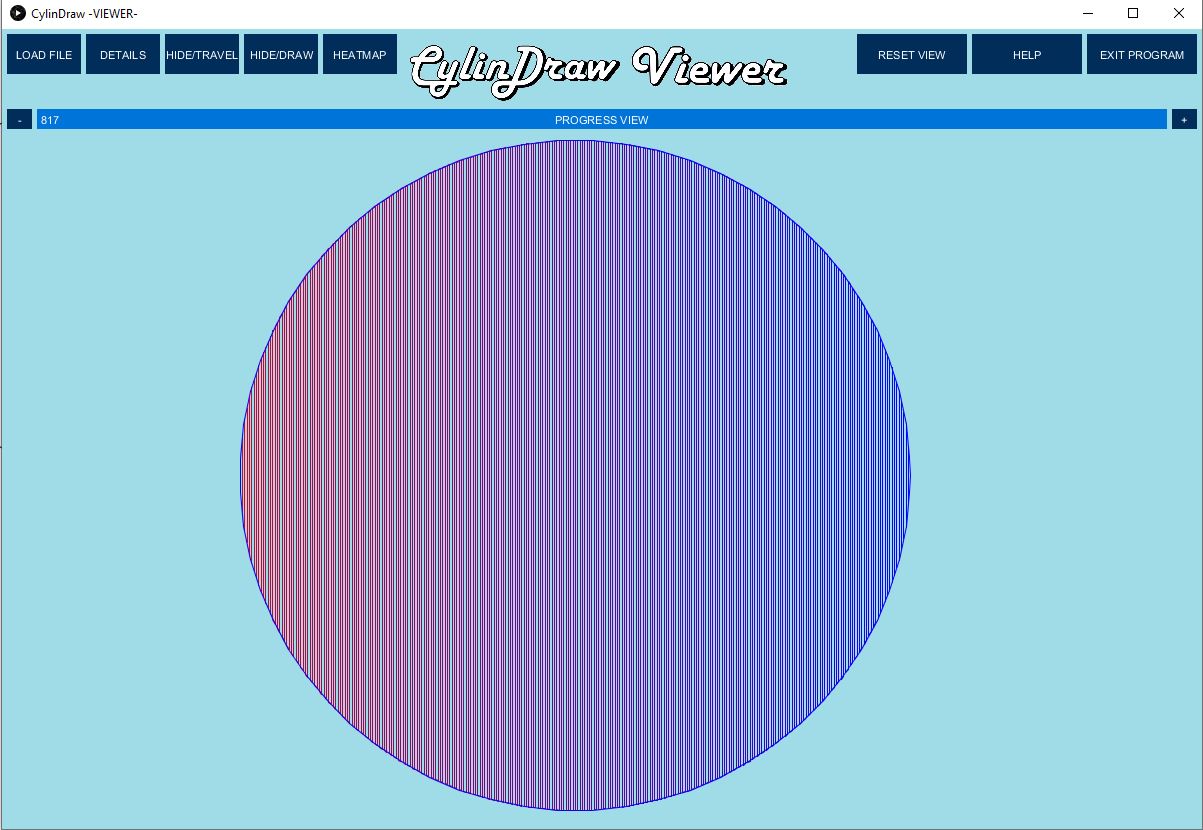
Lets say my kid asks me to color the inside of a circle, a process known as hatching. The optimal path algorithm is obvious, start at one side, swoop back and fourth repeatedly until the shape is filled.
Hatching is not supported by Potrace since it is not necessary for displaying images on a screen. It produces an outline & simply declares the interior to be a certain color.
To create the filled-in effect on a physically drawn image hatch paths must be calculated & then combined with the outline. It is also a tool-specific process because the appropriate spacing between strokes changes with the diameter of the pen you use.
Here I’ve illustrated the tool path of a hatched circle and I set the line color to linearly change from red to blue as the drawing progresses for visualization purposes. It looks exactly how you would expect.
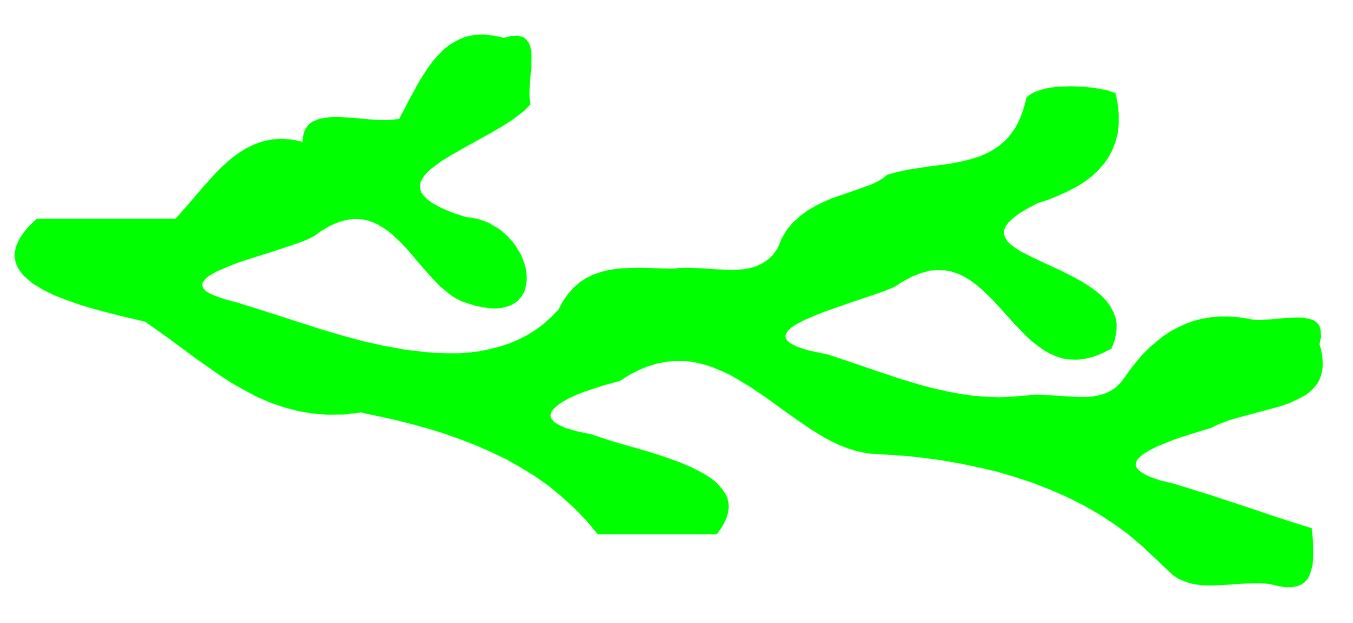
Now imagine kiddo giving me a more complex shape to fill in. The decision on how to optimally proceed is much less obvious. Marker in hand, my instinct is to just scribble furiously everywhere to finish before she gives me my next task.
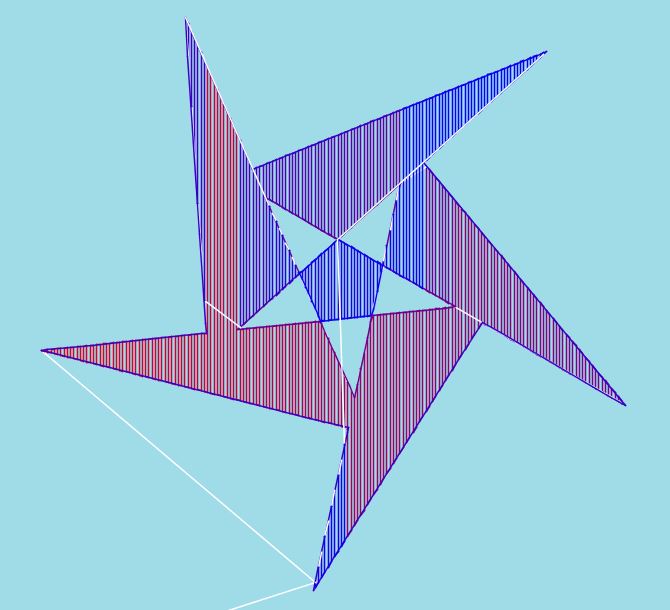
A more computer friendly approach we can try is to use is rasterization rendering. Start from the top corner, swoop across the entire width of the image only touching pen to paper where appropriate, move down one stroke width, & repeat swoop in reverse direction.
The path of motion is dead simple and this is how laser engravers usually generate paths. It produces a lot of wasted motion but they can get away with it because lasers can turn on and off instantaneously, so the benefit of operating at high motion speed far outweighs the time spent travelling over space that won’t be engraved.
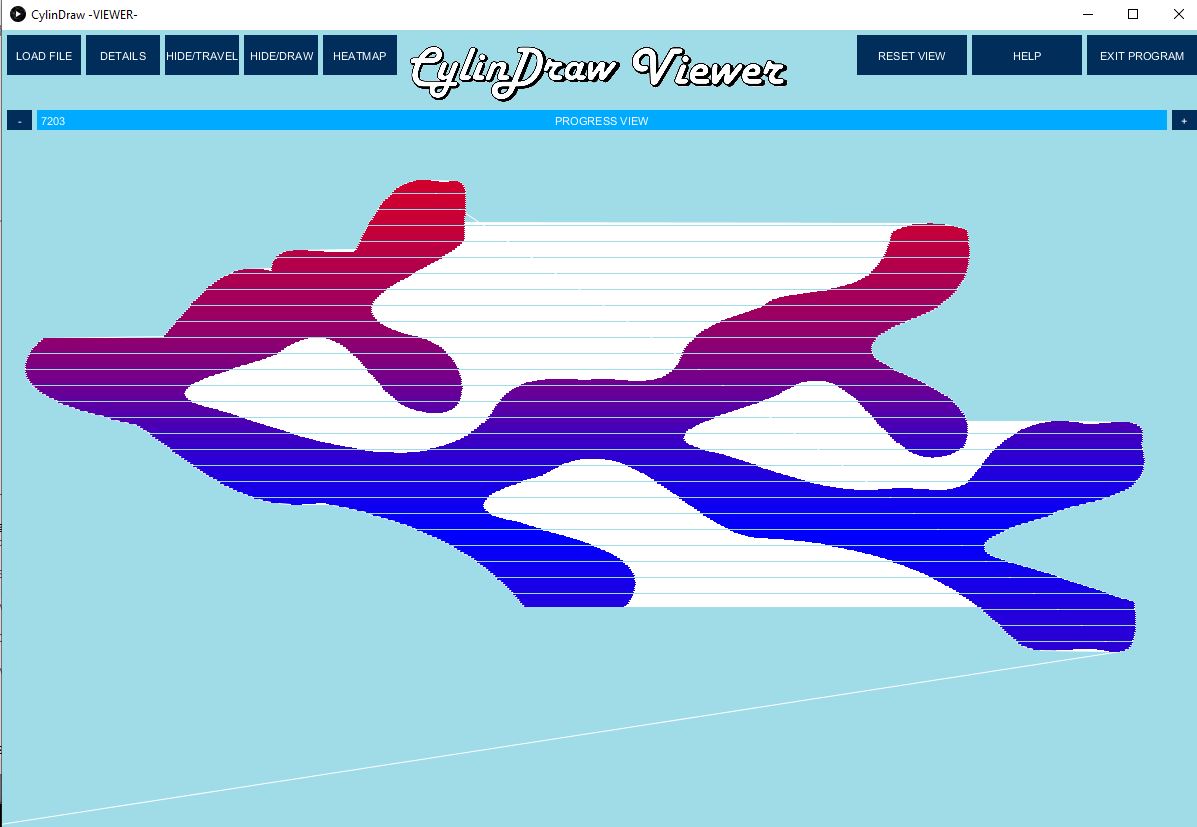
Here’s what that looks like. (The white lines are travel-only-paths, wasted motion.)
Rasterization rendering is also how computers refresh pixel colors on your monitor, and its how the DePixelizer program I wrote about last time converts images into vectors.
But this is not a very good plan for a plotter. (Or for me with marker in hand for that matter.)
The pen has to be physically lifted & lowered every time you transition from a travel-path to a drawn-path. A roundtrip process of ~1 second on the CylinDraw, deliberately limited in speed to prevent the pen from bouncing.
The cumulative effect is significant. The example above has 2048 individual lifts, and a total of 6130 separate points of interest to visit to complete the job.
Ideally we want to minimize the number of pen lifts, minimize the total distance of travel-only-paths, and if possible keep the average drawn-line length as long as possible. Long straightaways are better because the bot can spend more time at high velocities & waste less time accelerating/decelerating.
We have a long list of points to visit only once and we want the shortest possible route, effectively we’ve run into the travelling salesman problem.
…
I wanted my program to be able to import any kind of vector files, not just those made with the DePixelizer program, so I had to figure out a way to generate hatching using only the perimeters of shapes.
This is what I came up with.
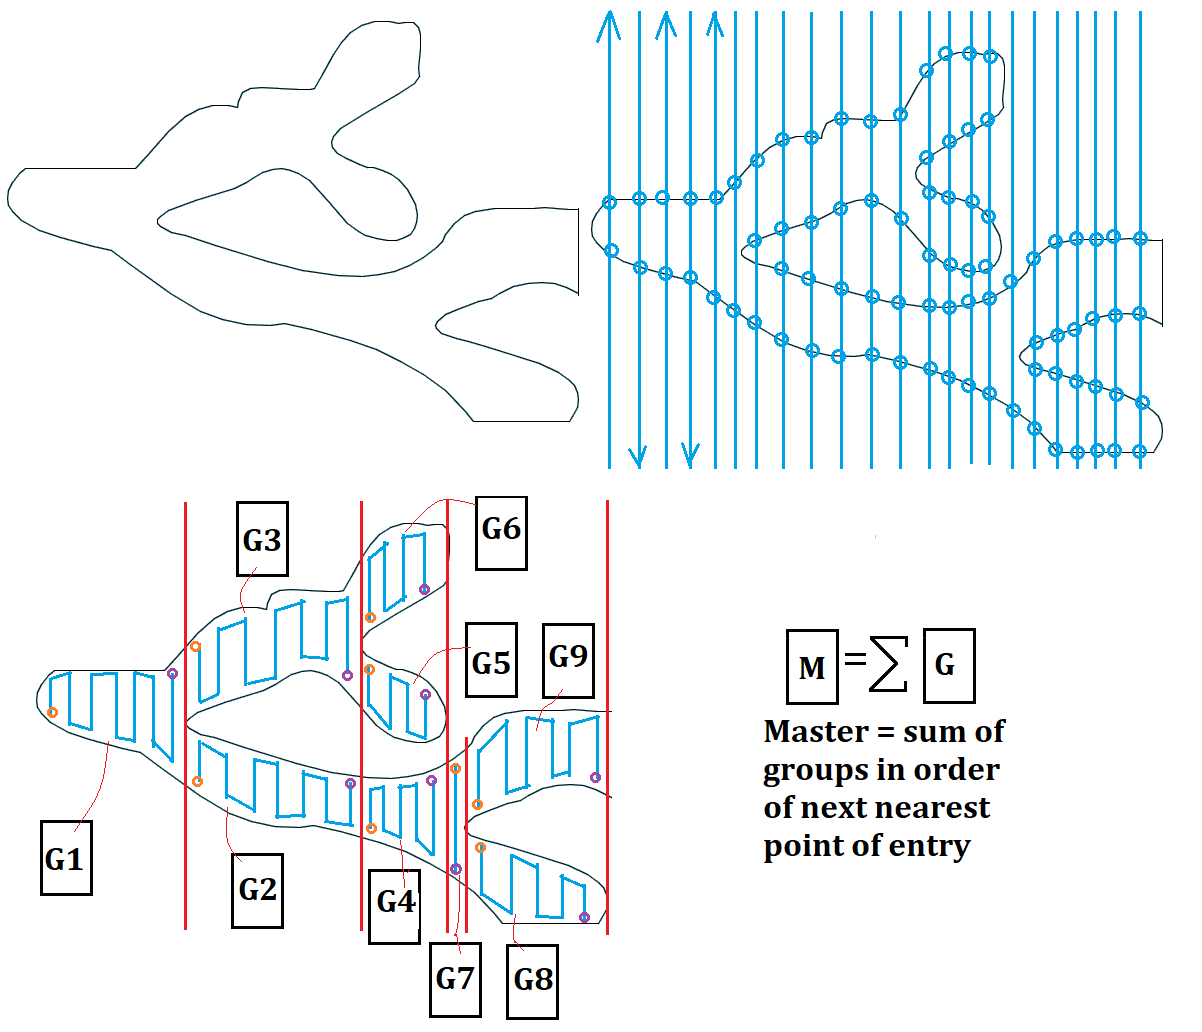
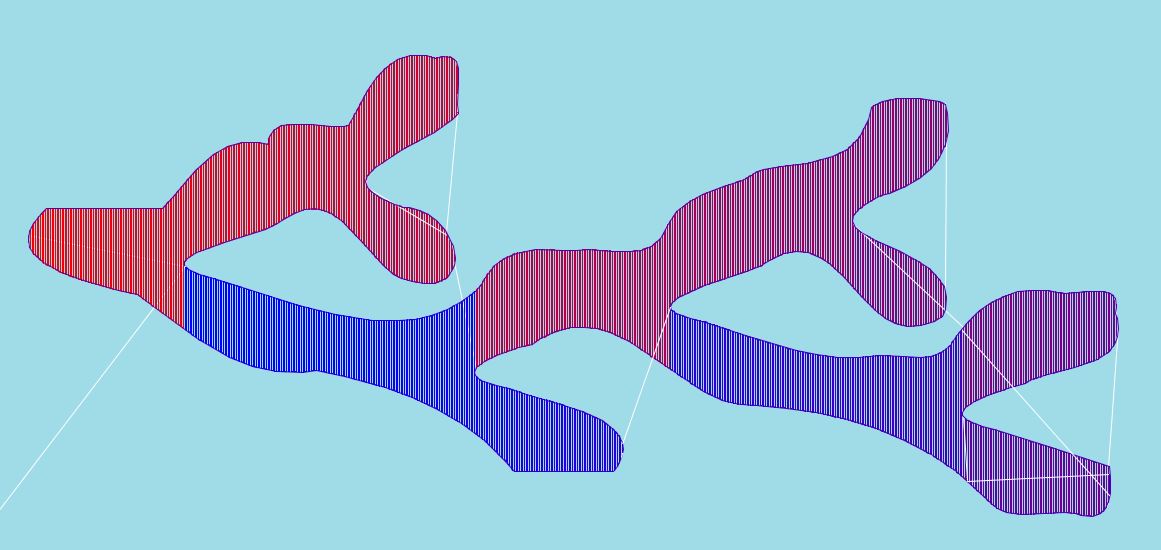
- Iterate over the SVG to separate out all the enclosed objects. Then for each closed object individually:
- Sequentially slice the object with an array of strokes spaced apart by the pen diameter. (blue lines) Everywhere the lines intersect the object will create at least 2 points of interest the bot will want to travel to. (Note there will always be an even number points of interest in a slice.)
- Collect both points of interest sequentially and add it to a running list, along with the color of the shape. Move directly from the last point found to the next point found, unless…
- …unless the number of points found in a slice is different than the number found on the previous slice. In that case create however many new lists (groups of sequential points) necessary so that each group is only getting two new points per blue slice line.
- When the end of the object is found, make a new blank master list & iterate over the lists of groups of the same pen color seeking the next nearest start or end point of the entire group. (greedy algorithm) If the next nearest point was the final point of a group then reverse the group order before adding it to the master list.
Using large groups as shown wasn’t strictly necessary; I found the system also works if you simply consider each 2 point line segment to be its own (tiny) group, since all groups are combined at the end & reordered with a greedy algorithm anyway.
However, this had a surprising & unintuitive effect on the result. I found that the additional constraint of large groups consistently had multiple benefits over line-segment-sized-groups.
Large groups prevented the greedy algorithm from making a short sighted decision to seek a locally optimal point at the cost of creating numerous inefficiently disjointed groups later. (There’s probably a parallel to be drawn here about the negative effect of frequent context changes on your brain/productivity)
Similarly, I found the starting position had an enormous effect on the greedy algorithm’s output. I found it was almost always best to start combining groups with the very first point & group being at one extreme side, then to finish off with the outline last since that may start or end anywhere.
Another benefit of large groups, the overall time to run the hatching code became near instantaneous because there are far fewer items to sort. The nature of sorting is such that doubling the number of items to sort on a single list will take more than double the time to sort. (I.e. Its quicker to sort 10 separate 10-book-shelves than a single 100-book-shelf.)
One big challenge was ensuring the transfer motion between groups did not mistakenly leave the pen down in cases when it should have lifted off the paper. To resolve this I simply assumed a lift was always necessary if the next group’s point of entry was more than a pen diameter away.
The final result is 31 total pen lifts & 2900 separate points of interest to visit. Neato.
Obviously there are a lot of ways this process could have been done, certainly many better than mine in different ways. At this point you’d have to start varying the slice direction & make the model iterate multiple times to try to get even slight improvements.
My main goal was not perfection but rather to ensure the output is error free every single time. For a system like this anything less than 100% reliable is 100% worthless. Reliability>>Perfectly optimal!
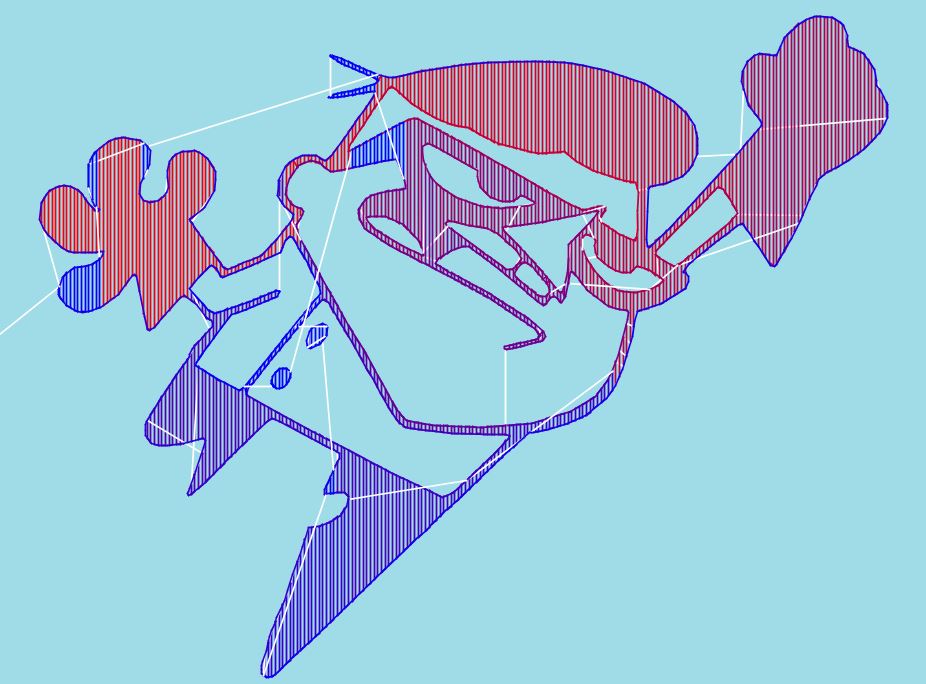
That’s why I used many different images to practice on while I figured all this out. Otherwise I’d risk ending up with a system ‘designed to pass the test’, that fails as soon as a unique situation comes along.
Other examples.
One final trick I came up with before I wrap up this topic.
Making progress & learning requires iteration, the faster you can iterate the faster you can learn.
The deliverable output of my slicing program is my variant of g-code, readily machine readable but not readily human viewable. It’s literally a text file thousands of lines long and at the beginning I had to copy & paste it into a g-code reader just to check how it worked out.
So to improve my ability to make progress faster I designed the system to output an SVG file that displayed the job preview and then embedded all the g-code at the end of that file between comment brackets so it didn’t affect the SVG format.
Then I installed a package that let me view SVG files in the thumbnail on my computer and I was able to organize experiments, review the results, and iterate much much quicker.
That’s all for now. Next time I’m looking forward to sharing a raspberry pi automation project.
..
Further Reading:
*Evil Mad Scientist ‘Creating Filled Regions’ in Inkscape.
*Evil Mad Scientist ‘TSP Art’, Vectors generated specifically to draw an image with a single continuous path.
*A higher lever but well explained article about optimizing plots with a Travelling Salesperson Problem Solver.
*Polygon Infill Algorithm Q&A on Stack Overflow
*Great source for ideas for crafts to do with young kids, art for kits youtube.

[…] to run a single piece, it varies with the complexity of the work (the reason why has to do with path planning as Ive discussed here). (I’ll add that CylinDraw’s initial cost is low enough that its feasible to buy 2 and […]
LikeLike